a bit of respite
010110_ _010110
rust-gdb. rust-lldb.
Unbeknownst to most Rustaceans, two little helpers have found their way into
almost any Rust installation over the last few months: rust-gdb and
rust-lldb. These are two small wrapper scripts that will start the underlying
debugger with Rust pretty printers enabled. The pretty printers are
Python-based extensions that hook into the debuggers output rendering, hopefully
making it easier to inspect your Rust program’s runtime state. This post will
describe what rust-gdb and rust-lldb can do for you, what their limits are,
and how to use them (hint: it’s easy!)
What To Expect
The probably biggest advantage of using the pretty printers is the improved rendering of enum values. Enums have a slightly convoluted debuginfo encoding that allows C-oriented debuggers to make sense of them even though they don’t know about Rust. The default rendering of a value with this encoding is rather unreadable though.
For example, a “regular” enum value like Ok(true) of type Result<bool, u64>
will look as follows in the debugger:
GDB: result = { {RUST$ENUM$DISR = Ok, true}, {RUST$ENUM$DISR = Ok, 0} }
LLDB: (core::result::Result<bool, u64>) result = {
          = (RUST$ENUM$DISR = Ok, true)
          = (RUST$ENUM$DISR = Ok, 0)
      }
A “space-optimized” enum value like Some(&123) of type Option<&u32> will be
even less decipherable:
GDB: {RUST$ENCODED$ENUM$0$None = {0x7fffffffdafc}}
LLDB: (core::option::Option<&u32>) option = {
          RUST$ENCODED$ENUM$0$None = {
              = 0x7fffffffdafc
          }
      }
The pretty printers rectify this situation, filtering out the discriminant and the wrong interpretations of the enum value. For the above examples you will get:
GDB:  result = Ok = {true}
      option = Some = {0x7fffffffdafc}

LLDB: (core::result::Result<bool, u64>) result = Ok(true)
      (core::option::Option<&u32>) option = Some(&0x7fffffffdafc)
Some other niceties that the pretty printers bring, are:
-
Readable rendering of
&strandstd::Stringvalues:Rust: let str_slice = "IAMA string slice!"; GDB: str_slice = "IAMA string slice!" LLDB: (not yet implemented) Rust: let string = "IAMA string!".to_string(); GDB: string = "IAMA string!" LLDB: (not yet implemented) -
Readable rendering of slices and
std::Vecvalues:Rust: let slice: &[i32] = &[0, 1, 2, 3]; GDB: slice = &[i32](len: 4) = {0, 1, 2, 3} LLDB: (&[i32]) slice = &[0, 1, 2, 3] Rust: let vec = vec![4, 5, 6, 7]; GDB: vec = Vec<u64>(len: 4, cap: 4) = {4, 5, 6, 7} LLDB: (collections::vec::Vec<u64>) vec = vec![4, 5, 6, 7]
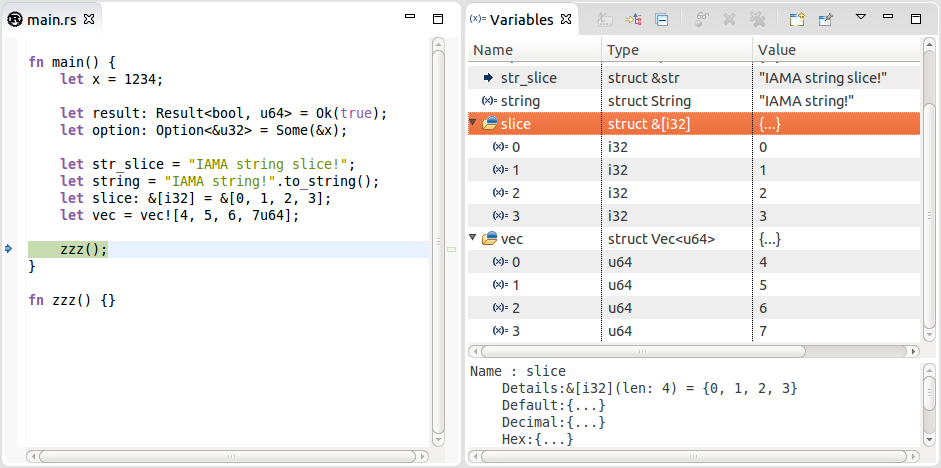
One thing to note about these pretty printers is that in principle they can also be enabled when the debugger is used through a UI front-end, such as XCode or RustDT. For the latter I have already tried this:
 </img>
However, this isn’t yet supported out-of-the-box for any debugger front-end and
enabling pretty printers can be a bit cumbersome. The brave
and fearless can take a look at the rust-gdb and rust-lldb scripts and try
to make their favorite debugger front-end start the debugger process with these
settings added.
What Not To Expect
While these pretty printers definitely improve the debugging experience for Rust programs, there are limits to what can be done in terms of language support short of actually going into the debuggers’ core codebase and making the language a first-class citizen.
The most prominent thing that cannot be implemented by mere Python-extensions is expression parsing and evaluation. As a consequence, when debugging a Rust program, the debugger will basically treat the program as if it were actually written in C/C++.
Some of the things in Rust are similar enough to C that you can use them
just the same, such as arithmetic expressions over primitives, e.g. 2 + 4 * 5,
or directly accessing the fields of a struct.
However, many other things work differently under the hood in Rust than in C and the debugger will balk at your trying to use these constructs, among them such fundamental things as accessing elements in a slice, accessing fields of an enum or tuple, anything that uses auto-dereferencing, or calling Rust-defined methods, functions, or closures.
If the you know the internal representation of things you can do some funky stuff like using C pointer arithmetic to access elements in a slice:
print slice.data_ptr[3]
In general, however, the situation in this respect is most unsatisfactory. In order to support these crucial features, someone will have to go and directly extend the LLDB and GDB codebases. But back to the good news of this post.
Usage
rust-gdb and rust-lldb are just small shell scripts that inject some
additional commandline arguments into the invocation of the underlying debugger.
These additional arguments make sure that the proper pretty printers are loaded
before anything else is done. The rest of the commandline arguments given to the
rust-gdb/rust-lldb scripts are passed along unmodified to the underlying
debugger. In other words, you should be able to use the scripts exactly like you
would use the respective debugger.
Here are some common examples:
-
Starting a Rust executable without any arguments:
rust-gdb ./your-program rust-lldb ./your-program -
Starting a Rust executable with additional arguments to the debugger:
rust-gdb -statistics ./your-program rust-lldb --no-use-colors ./your-program -
Starting a Rust executable with arguments to the debugger and arguments to the executable being debugged:
rust-gdb -statistics --args ./your-program --prog-arg1 --prog-arg2
rust-lldb --no-use-colors  --  ./your-program --prog-arg1 --prog-arg2
Note that the rust-gdb/rust-lldb scripts will always use the debugger in
your PATH, e.g. rust-gdb internally just calls gdb without any
qualifications. The scripts also assume that there is a valid rustc in your
PATH, which they use to find the pretty printer plugins.
If you have installed Rust (e.g. via the nightly-installer or
rustup.sh) you
should be good to go out-of-the-box, since the installer will have put
rust-gdb (on Linux) or rust-lldb (on Mac OS X) right next to your rustc
and cargo executables.
On Windows rust-gdb is not installed by default because GDB has
sometimes been rather unstable on this platform. You can still give it a try by
running the rust-gdb script file found in src/etc/ in a MinGW shell.
Since pretty printer plugins are implemented in terms of the debuggers’ Python APIs, and these have changed over time, the minimum supported debugger versions are GDB 7.7 and LLDB 310. However, the general rule is: the newer the better.
If you are using a moderately recent Linux or Mac OS X version, and have an
up-to-date Rust installation, chances are good that everything will just work,
i.e. that you can use rust-gdb/rust-lldb from the commandline just as you
would use GDB or LLDB.
Closing Words
Over the coming months there will hopefully be a few minor feature additions, like pretty printers for more standard library types and frame decorators. As always, if you encounter any bugs, please open an issue on Github.
Happy debugging 