a bit of respite
010110_ _010110
What you call the present, we call the past
Now that the Summer of Code is over, it seems like the proper time to give an overview on the state of debugging information in Rust and to talk a bit about what I was able to accomplish this last three months. In order to make this an interesting read for you, I thought it might be a good idea to combine this with a guide on how to use the new features in your projects.
The main goal of my GSoC project has been to make rustc produce (more) DWARF debug symbols for its executables. DWARF is a standard format for describing debug information for various languages. An executable containing debug symbols in this format can be run in different debuggers―most notably GDB and LLDB.
Now, command-line debuggers like GDB and LLDB are definitely excellent tools providing a lot of useful functionality and doing a lot of heavy lifting in handling executables and interpreting debug information. But using them through the command-line can be a bit cumbersome. A graphical user interface usually provides a better overview of the situation where one can find out what’s going on more quickly. For this reason (and because it makes for better screenshots :) I’ll briefly describe how to debug Rust programs using Eclipse as a GDB front end.
Debugging Rust in Eclipse
First we’ll need an Eclipse instance with C/C++ Development Tools installed. I simply used a fresh install of the latest version of Eclipse IDE for C/C++ Developers.
Once this is installed/unpacked, we need to tell Eclipse that .rs files are valid source files to be shown in the debugger:
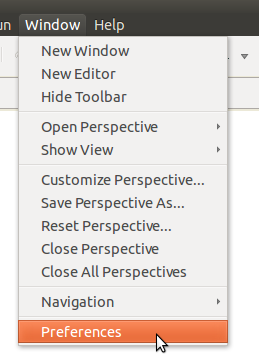
- Go to
Window -> Preferences,
 </img>
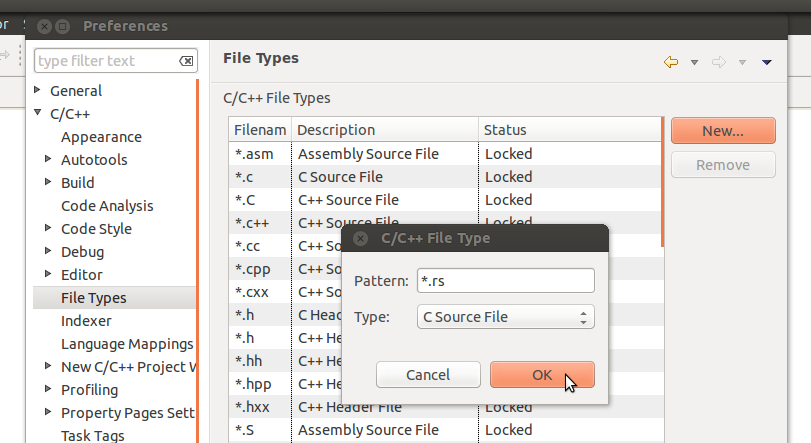
- then under
C/C++ -> File TypesclickNew..., and
 </img>
- add the pattern
*.rsas C Source File.
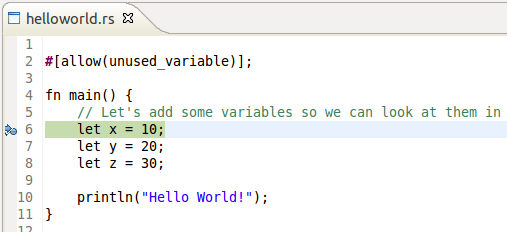
With this Eclipse is essentially ready to handle Rust. Next we need an actual program to debug. For starters a small Hello World program will do:
#[allow(unused_variable)];

fn main() {
	// Let's add some variables so we can look at them in the debugger
	let x = 10;
	let y = 20;
	let z = 30;

	println("Hello World!");
}
In order to compile this program with debug information we use the -Zextra-debug-info flag:
rustc -Zextra-debug-info ./helloworld.rs
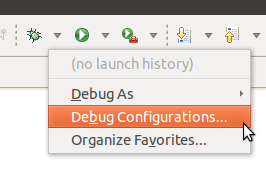
This will produce an executable named helloworld in the same directory as the source file. For running this executable in Eclipse, open the Debug Configurations menu…
 </img>
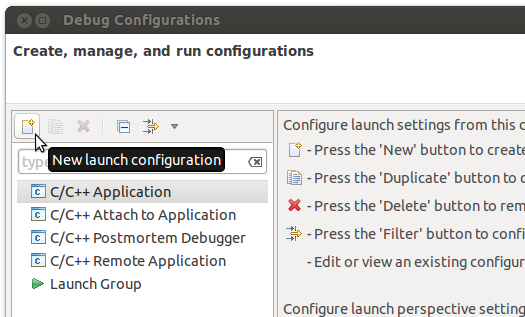
…and create a new C/C++ Application configuration:
 </img>
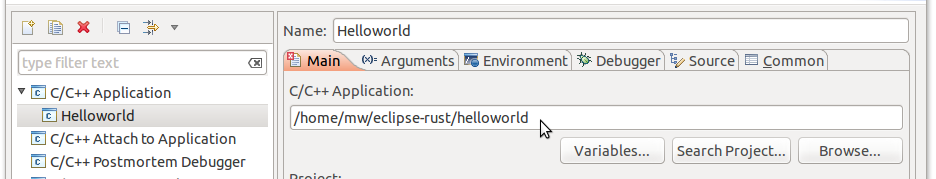
Note that you don’t have to create any kind of project in the workspace for using the debugger (although having a Makefile project might prove to be quite handy, I haven’t tried that yet). Give the debug configuration a descriptive name and select the executable produced earlier:
 </img>
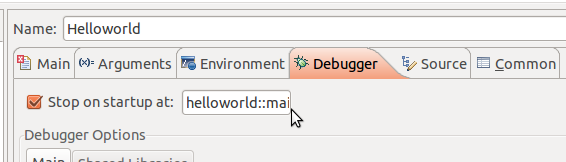
Finally, in the Debugger tab, we have to adapt the initial breakpoint for the program. By default it is main, but since the Rust compiler will produce a root-namespace for the program, it rather has to be helloworld::main:
 </img>
Otherwise the debugger might break in some internal runtime function also containing the string “main” and then tell you that it can’t find the source file for this code position and you won’t know what the heck is going on. We don’t want that. This is kind of a quirk and I hope to find a nicer solution for this in the future. Luckily, most of the time we’ll just set breakpoints somewhere in a source file and won’t have to deal with this.
Other than that we are ready to go: Click Apply so this configuration can be used later on and then click Debug.
Basic Functionality
We now are good to use basic debugger functionality, like:
- Setting breakpoints
 </img>
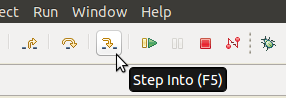
 - Stepping through the code
 </img>
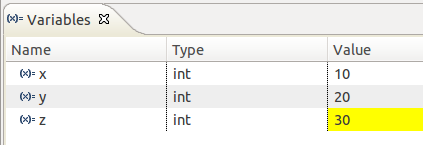
 - Inspecting variables
 </img>
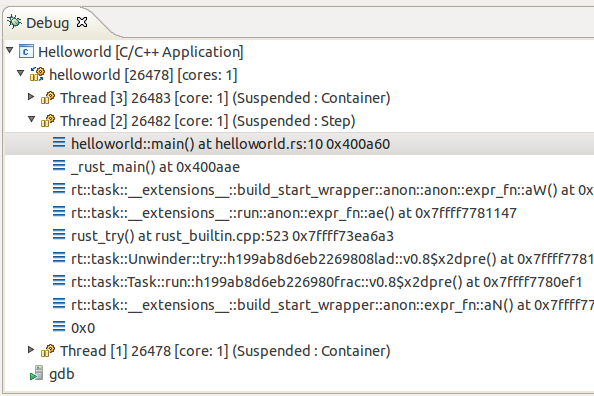
 - And viewing the stack trace
 </img>
 </img>
 </img>
 </img>
 </img>
All of this is also available in the commandline version of GDB, but it is rather nice and useful to watch variable values change as you step through the code :)
Rust-Specific Features
There are quite a few features in Rust that are not found C/C++ but that need solid support nonetheless to make the debugger useful. Why do we radical Rusticals care what C/C++ does or doesn’t do? Because GDB treats Rust program as C/C++, that is, like for all source languages unknown to it, GDB uses its built-in MINIMAL language which is essentially C. The following lists some important Rust features and how GDB handles them:
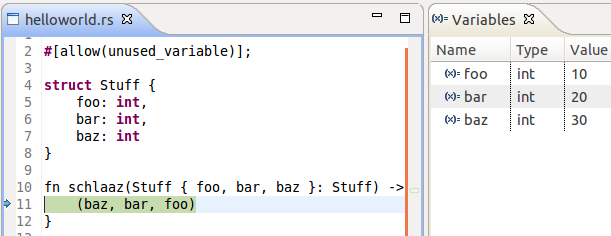
Destructuring
Since it’s so handy, typical Rust code contains lots of variable destructuring, so it’s important to get this right. Fortunately, there’s no real problem here: There is only a syntactic difference between Variables declared with destructuring and normal ones. The debugger/DWARF is only interested in the variable’s name, type, memory location, scope, all things also available for variables declared as part of a pattern. This is implemented since pull request #8045.
 </img>
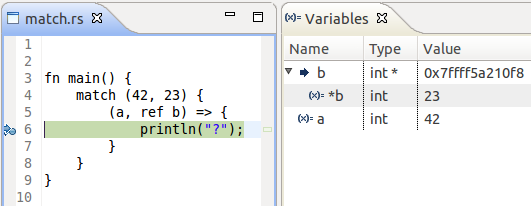
Match Statements
These too are ubiquitous in Rust code, since (among other things) match is the only way of accessing enum fields. And here too good debugger support is quite possible, as PR #8329 shows: We just have to introduce appropriate scope and variable description in the right places:
 </img>
Variable Shadowing
In Rust one can introduce several variables with the same name in the same scope:
let amount = stream.readline();
let amount = string_to_int(amount);
A subsequent declaration will shadow any previous one, i.e. if you use some name x, it will always refer to the variable declared most recently. Unfortunately GDB does not handle this correctly when given DWARF symbols that describe this as found in the program. GDB will always display the first variable declared with a certain name in a given scope. Luckily, we can just describe Rust’s implicit scoping hierarchy in DWARF by introducing explicit, artificial lexical scopes at every let binding that reuses a variable name. You can read about some of the implementation details of this in an earlier blog post. The upshot is this: It works :)
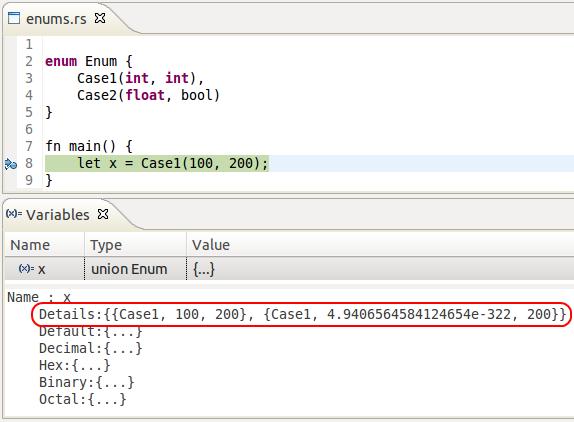
Enums
Well, that’s a sore spot at the moment. There is no such thing as a Rust enum in C/C++ or GDB’s MINIMAL language and it shows: Enum values are described as DWARF union types which is the equivalent to C unions. Undesirable side effect: GDB prints all possible interpretations of the enum, ignoring the discriminator field (it’s just another field to GDB). So, the output looks as follows:
 </img>
One can still find out what the correct value/interpretation is, the discriminant value is always displayed correctly―but pretty is something else. DWARF, in theory, supports discriminated unions (see 5.5.9 Variant Entries in version 4 of the standard) but LLVM does not support this and GDB only does in Ada mode. In the future a GDB pretty printer might improve the situation here―I am not sure, however, how well this plays together with something like the Eclipse front-end.
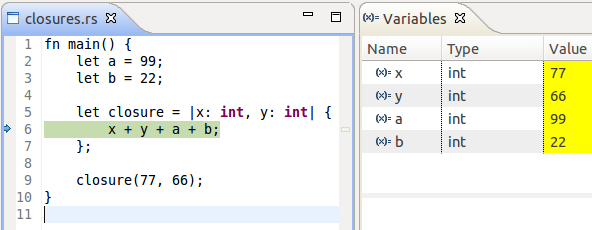
Captured Variables
Another important thing: Idiomatic Rust code uses closures quite often, so we want to make sure that captured variables are well supported. DWARF expressions provide rather flexible machinery to implement this. LLVM only exposes a very small subset in DIBuilder but everything needed for following pointers is available. As of pull request #8855 this works pretty well, captured variables just show up like normal variables:
 </img>
Stability and Known Issues
Although support for debug info has grown over the summer (at least exponentially, I’d say), it still has some way to go before being really stable. I’ve tried to safeguard the implementation with lots of automated tests but in-production-use is bound to uncover bugs and usability quirks. Some known issues are:
Peculiar Stepping Behavior
You will probably experience some odd jumping around in the code at times while stepping through the code. This is because some machine instructions are linked to wrong source code positions. These problems don’t become visible in the automated tests and have thus long gone unnoticed by me. This should be fixable with some fine tuning in code generation.
No Support for Global/Static Variables
This is just not implemented yet. (see #9227)
By-Value Self-Argument Ignored
The self argument in methods has some special handling in the trans module and is treated differently from other function arguments. Debug info adds some special requirements which are not met for by-value self arguments. There is no principal problem, just some code untangling that needs to be done before this can be implemented.
Calling Functions from the Debugger
This is something I have not tried even once :) It may work for simple cases. It definitely won’t work for anything involving dynamic dispatch.
Namespace Issues
There are some open issues regarding DWARF namespaces (which in Rust can be introduced by crates, modules, functions, traits, and impls). In particular, you’ll sometimes get warnings about namespace nodes not being found for some item or other (e.g. #9167). Namespace support is in for a refactoring which should also make this a non-issue.
Minor DWARF Standard Conformance Issues
There are a few things that could be described more accurately in the debug information, especially regarding generics (#9224, #8641) but also things like struct member visibility (#9228). These should definitely be addressed some time in the future. But as they don’t interfere with the regular debugging experience I’d regard them as rather low priority.
The Distant Future (…the year 2000)
After the issues above are resolved there are some things on my wish list that would further improve the debugging experience and implementation stability. One thing that might make sense is to directly test the generated DWARF data. At the moment the automated tests consist of small programs being run through GDB and we check if GDB reads out correct variable values at given breakpoints. This approach is a very good idea and we should continue to have these tests. But some things, like namespaces, are hard to test this way. There are libraries like libdwarf or pyelftools that allow to inspect the debug information contained in a binary. Test cases that directly check whether the DIE-structure for a given program looks as expected could then act as a kind of active specification of how to describe Rust programs in DWARF.
Another thing on my wish list are GDB pretty printers. These would allow to display values as they appear in Rust as opposed to C. This would be especially nice for enums which―as mentioned above―have rather ugly output at the moment. But also functions, tuples, vectors could profit from this.
By far the most ambitious project would be a real, native Rust debugger and adoption of Rust into the DWARF standard. Both are probably more feasible than they seem at first sight. DWARF already supports most of what’s needed for Rust. A few type modifiers for e.g. ~ and @ would be nice, also having special tags for traits and tuples. But these should not require much more than adding some DW_TAG_* constants to the standard. The more complicated things like discriminated unions are actually already in place.
On the debugger side, LLDB would probably provide for a very good foundation for a native Rust debugger, once it is mature enough. It would still be quite an undertaking but one could start far from zero. I’m looking forward to seeing what the future brings in this regard :)
Acknowledgments 

Since this is a kind of GSoC-conclusion post I want to take the time to thank my GSoC mentor Josh Matthews who has been of great help the whole time. Thanks Josh! :) I also want to thank Brian Anderson and Graydon Hoare for their encouraging comments and the rest of the Rust community for being awesome!
And of course thanks to Google for organizing this program―keep it up!